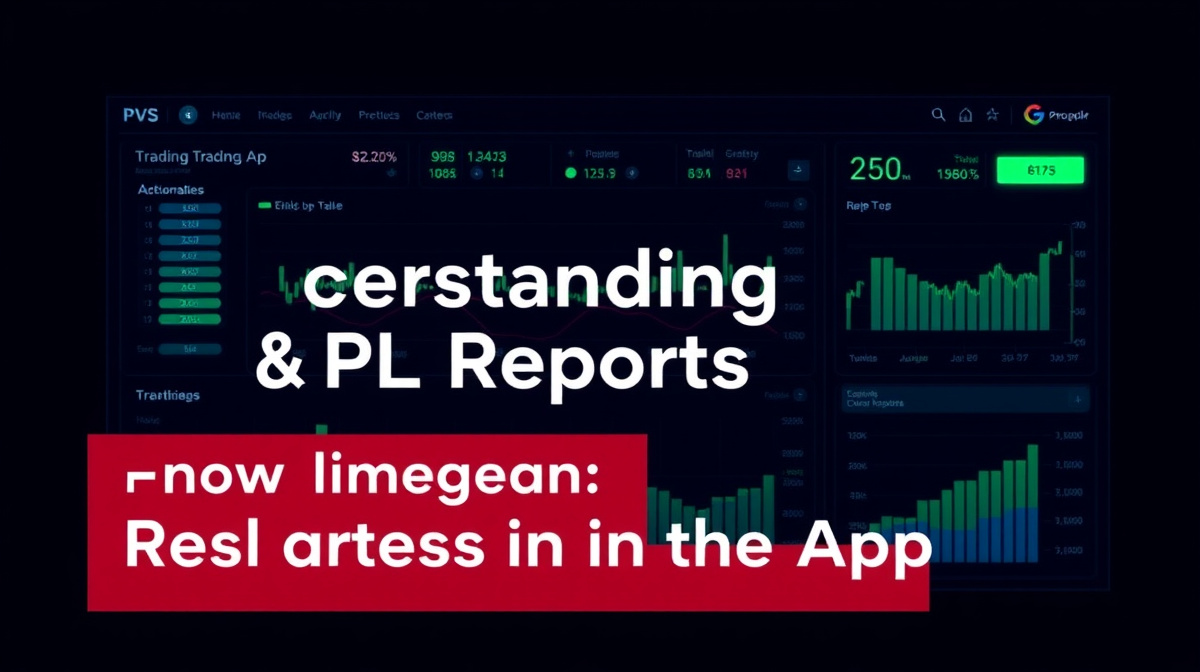
Understanding Your P&L Reports in the App
Your profit and loss statement is the single most important report in any trading journal. It tells you, in cold hard numbers, whether your trading is working. But a P&L report can also mislead you if you only look at the bottom line. In this walkthrough, we will explore how Trader Journal App's P&L reports give you a full picture of your trading performance — from daily profit snapshots to detailed breakdowns by strategy, market, and time period.
Why a Standard P&L Is Not Enough
Most traders open their broker statement at the end of the month, see a number, and call it done. Either they made money or they lost money. But that single number hides everything that matters: which strategies are working, which days of the week perform best, whether your gains come from good entries or lucky exits.
Trader Journal App's P&L reports are designed to answer questions your broker statement never will:
- Which of my strategies actually produces consistent profits?
- Am I making money on certain days of the week and losing on others?
- Is my P&L improving month over month, or am I plateauing?
- How much of my profit comes from my best 10% of trades versus my overall execution?
Opening Your P&L Report
Once you have logged at least a few trades in the app, the P&L report is available from the main dashboard. Navigate to Reports from the sidebar menu and select P&L Report. The report loads automatically with your default date range — typically the current month.
The first thing you see is a summary card at the top showing:
- Total P&L: The net profit or loss for the selected period.
- Total Trades: How many trades were executed.
- Win Rate: Percentage of trades that closed at a profit.
- Average Trade: The average P&L across all trades in the period.
This summary refreshes instantly whenever you change the date range. Use the date picker at the top right to switch between daily, weekly, monthly, and custom date ranges.
Breaking Down Your P&L by Strategy
One of the most powerful features of the P&L report is the breakdown by strategy. If you tag your trades with strategy labels when you log them (such as "Breakout," "Pullback," or "Scalp"), the report automatically splits your P&L by each strategy.
To set this up:
- Go to your Trade Settings and create strategy labels under the Tagging section.
- Apply a strategy tag to every trade you log. For past trades, you can bulk-edit them from the trade list.
- Open the P&L Report and click the "Group By Strategy" toggle.
The report now shows a row for each strategy with its own P&L, trade count, win rate, and average R-multiple. A quick scan tells you which strategies are carrying your portfolio and which are dragging it down.
Real example: A scalper notices their Scalp strategy shows a positive P&L of +$340 across 45 trades, while their Swing strategy shows --$120 across 8 trades. The data tells them to scale up scalp setups and reduce swing position sizes until they refine that approach.
P&L by Market and Instrument
If you trade multiple instruments or markets (stocks, forex, crypto, futures), the report can group your P&L by market type or by individual symbol.
Switch to the "By Market" view to see a breakdown like this:
| Market | P&L | Trades | Win Rate |
|---|---|---|---|
| Stocks | +$1,245 | 67 | 62% |
| Crypto | -$340 | 23 | 43% |
| Forex | +$210 | 15 | 53% |
Now you see that your crypto trading is eroding your stock profits. This kind of cross-market view helps you decide where to focus your attention and capital.
The P&L Timeline Chart
Below the table view, the report includes an interactive P&L timeline chart. This chart plots your cumulative P&L over time. Each trade adds a point to the line.
The timeline chart is useful for:
- Spotting drawdowns: A sustained downward slope tells you when a losing streak started and how deep it went.
- Measuring recovery: After a drawdown, does your P&L recover quickly or does it limp back? The slope of the recovery tells you about your strategy's resilience.
- Identifying plateaus: A flat line means you are treading water. Even if your P&L is positive, a flat line over two weeks suggests your edge is not producing results right now.
Hover over any point on the chart to see the trade that caused the change. This makes it easy to go from "I see a dip" to "Ah, that was the day I took three low-probability breakout trades."
Daily vs. Cumulative P&L
The P&L report offers two view modes: daily and cumulative.
Daily P&L shows each trading day as a separate bar. Green bars are profitable days, red bars are losing days. This view helps you see:
- How many green days versus red days you have (consistency).
- The size of your biggest winning and losing days.
- Whether your losing days are clustered (which signals a systemic issue) or random.
Cumulative P&L shows a running total. The line goes up on green days and down on red days. This view answers the big question: "Overall, am I going up or down?"
Switch between these views using the toggle above the chart.
Using Filters to Pinpoint Problems
The P&L report includes filter options that let you drill into specific subsets of your trades:
- Time filters: View P&L by hour of day, day of week, or month of year.
- Position size filters: Compare P&L on small positions versus large positions.
- Direction filters: See separate P&L for long trades and short trades.
Practical example: A trader uses the day-of-week filter and discovers they lose money every Wednesday. Looking closer, they realize Wednesday is when they trade during lunch meetings and make rushed decisions. They decide to stop trading on Wednesdays or only take A+ setups on that day. Over the next month, their weekly P&L improves by 22%.
Exporting Your P&L Report
Need to share your P&L with a mentor, coach, or for tax purposes? The app lets you export your P&L report in two formats:
- CSV: A raw data export you can open in any spreadsheet program. Includes every trade with its P&L contribution.
- PDF: A formatted report suitable for sharing or filing. Includes the summary card, breakdown tables, and timeline chart.
To export, click the Export button at the top of the report and choose your format. The file downloads immediately.
Setting P&L Goals and Alerts
The P&L report integrates with the app's goal-setting feature. You can set daily, weekly, or monthly P&L targets. The report then shows a progress bar comparing your current P&L against your target.
To set a P&L goal:
- Go to Settings > Goals.
- Click "Add Goal" and select "P&L Target" from the type dropdown.
- Set your target amount, period (daily, weekly, monthly), and start date.
- The P&L report now shows a progress indicator.
The app can also send you an alert when you hit your daily P&L target or when you exceed a loss limit you set. These alerts help you avoid two common problems: quitting too early on a good day and revenge trading after hitting your loss limit.
Comparing Periods
One of the most underused features of the P&L report is period comparison. You can compare your current period against a previous period side by side.
To use this:
- Set your primary date range to this month.
- Click "Compare With" and select "Last Month."
- The report shows two columns: one for each period.
Now you can see at a glance whether your P&L is improving, whether your win rate is trending up, and whether your average trade size has changed. This is the closest thing to a report card for your trading.
Example: A trader compares March against February. March shows +$890 from 42 trades, while February shows +$420 from 38 trades. The P&L doubled, but trade count only increased by 4. The real story is that the average winning trade grew from $28 to $45 -- meaning the trader improved their exits. The period comparison makes this obvious in seconds.
Putting the P&L Report Into a Routine
A P&L report is only useful if you actually read it. Here is a simple weekly routine:
- Sunday evening: Open the P&L report for the past week. Scan the summary card.
- Monday morning: Check the by-strategy breakdown. Which strategy earned the most? Which one needs work?
- End of month: Run the period comparison. Compare this month against last month and the same month a year ago.
Make this routine as automatic as logging your trades. The P&L report is the feedback loop that turns data into improvement.
How Trader Journal App Helps
All of this analysis happens automatically when you log your trades in Trader Journal App. The P&L report updates in real time as you add trades. There is no exporting to spreadsheets, no manual calculations, no formula debugging. Every breakdown -- by strategy, market, instrument, time period -- is generated from the trades you already logged.
The P&L report is one of several built-in reports designed to give you actionable insights without extra work. When you open the app and navigate to Reports > P&L Report, everything you need is already there: the summary, the breakdowns, the charts, and the export options.
Conclusion
Your P&L report is the scoreboard of your trading business. A proper P&L report shows you not just whether you won or lost, but why and where. Trader Journal App's P&L reports give you multiple angles on your performance: by strategy, by market, over time, and in comparison to previous periods.
Start with the summary card to get the big picture. Then drill into the breakdowns to find your strengths and weaknesses. Use the timeline chart to see your journey. And make period comparisons a regular habit. The more you use the P&L report, the more clearly you will see what is working and what needs to change.
Ready to see your real P&L picture? Log your trades in Trader Journal App and open the P&L report today.
This article is for informational purposes only. Trading involves financial risk. Past results do not guarantee future performance.